Offbeat Donuts Co.
How Offbeat Donuts Built a Waste & Production Dashboard Across 14 Locations from Zero Finished-Product Data
Offbeat Donuts Co. had limited production visibility across its shops, with only basic untopped donut quantities being shared by text. Higher-value finished donuts, production runs, waste, and delivery patterns were not being properly tracked. A custom Offbeat Waste & Production Tracker and Offbeat Waste & Production Dashboard were built to capture daily operational data and turn it into clear insight across 14 locations and 20+ products.
At a Glance
The project in brief
Industry
Food & Beverage / Retail Food Production
Company Size
14 locations, used by directors, operations managers, production staff, and shop managers
Challenge
Limited production and waste tracking, with no clear visibility over finished donut waste, production runs, or shop-level trends
Solution
A custom full-stack tracker and analytics dashboard for capturing topped donut production, waste, unfinished donut deliveries, and location performance
Key Results
The Challenge
Limited visibility over production, waste, and finished donuts
Offbeat Donuts Co. had limited visibility over daily production and waste. The only tracked information was the number of untopped donuts produced, how many were sent to each shop, and how many were left at the end of the day. This was shared by text, making it difficult to analyse trends or compare performance across locations.
The larger issue was that topped, finished donuts were not being properly tracked. These products are more valuable than untopped donuts, so waste had a much bigger commercial impact. Without clear data, the business could not easily see which finished products were being wasted, which shops were overproducing, or which products were not selling well.
Production timing was also difficult to assess. Without production run data, it was difficult to understand whether waste was caused by poor demand, overproduction, late production, or the wrong product mix. The business needed a system that could move decision-making away from gut feel and toward clear operational data.
Before vs After
From text-based gut-feel tracking to structured production and waste visibility
Before
- Only untopped donut quantities tracked, shared by text
- No visibility over finished donut production or waste
- No structured production run data
- Shop performance compared manually or not at all
- Decisions based on gut feel rather than operational data
After
- Topped and untopped donut production tracked daily across 14 locations
- Full visibility over finished donut waste by variety, shop, and day
- Production run data captured and linked to waste analysis
- Location comparison in seconds across all 14 shops
- Data-led production decisions replacing gut feel
Phase 1 — Data Capture
Offbeat Waste & Production Tracker
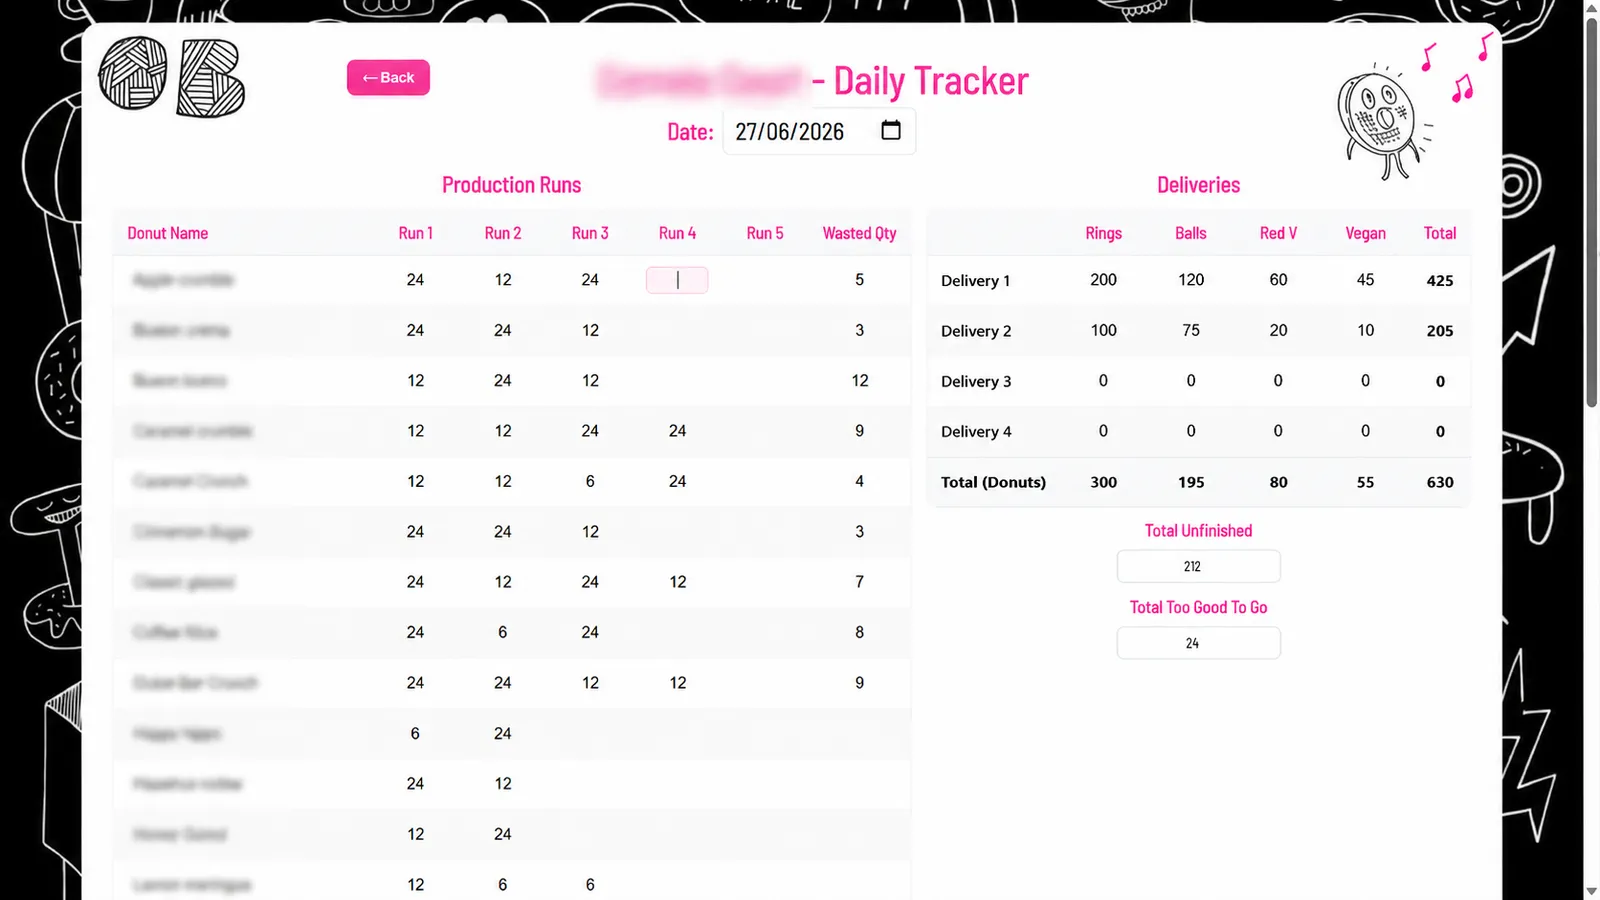
Before any analysis was possible, the data had to exist. The Offbeat Waste & Production Tracker was built to capture the operational data that previously did not exist in a structured format. Production staff use the tracker throughout the day to record topped donut production and untopped donut deliveries, submitting waste at the end of each day.
Daily Production & Waste Tracking
Production staff record topped finished donut production, waste by donut variety, and production runs throughout the day. At end of day, waste is filled in and the tracker is submitted — creating a consistent, structured record where none existed before.
Untopped Donut Deliveries
Shop-level delivery data captures untopped donut types — including ring, ball, and red velvet — alongside quantities sent to each location. This gives the business a clearer view of unfinished donut movement across shops.
Centralised Data Storage
Every entry is written to a shared database the moment it is saved. No scattered texts, no emailed files — all 14 locations feed into one place, immediately and automatically, ready for analysis.
Admin Management
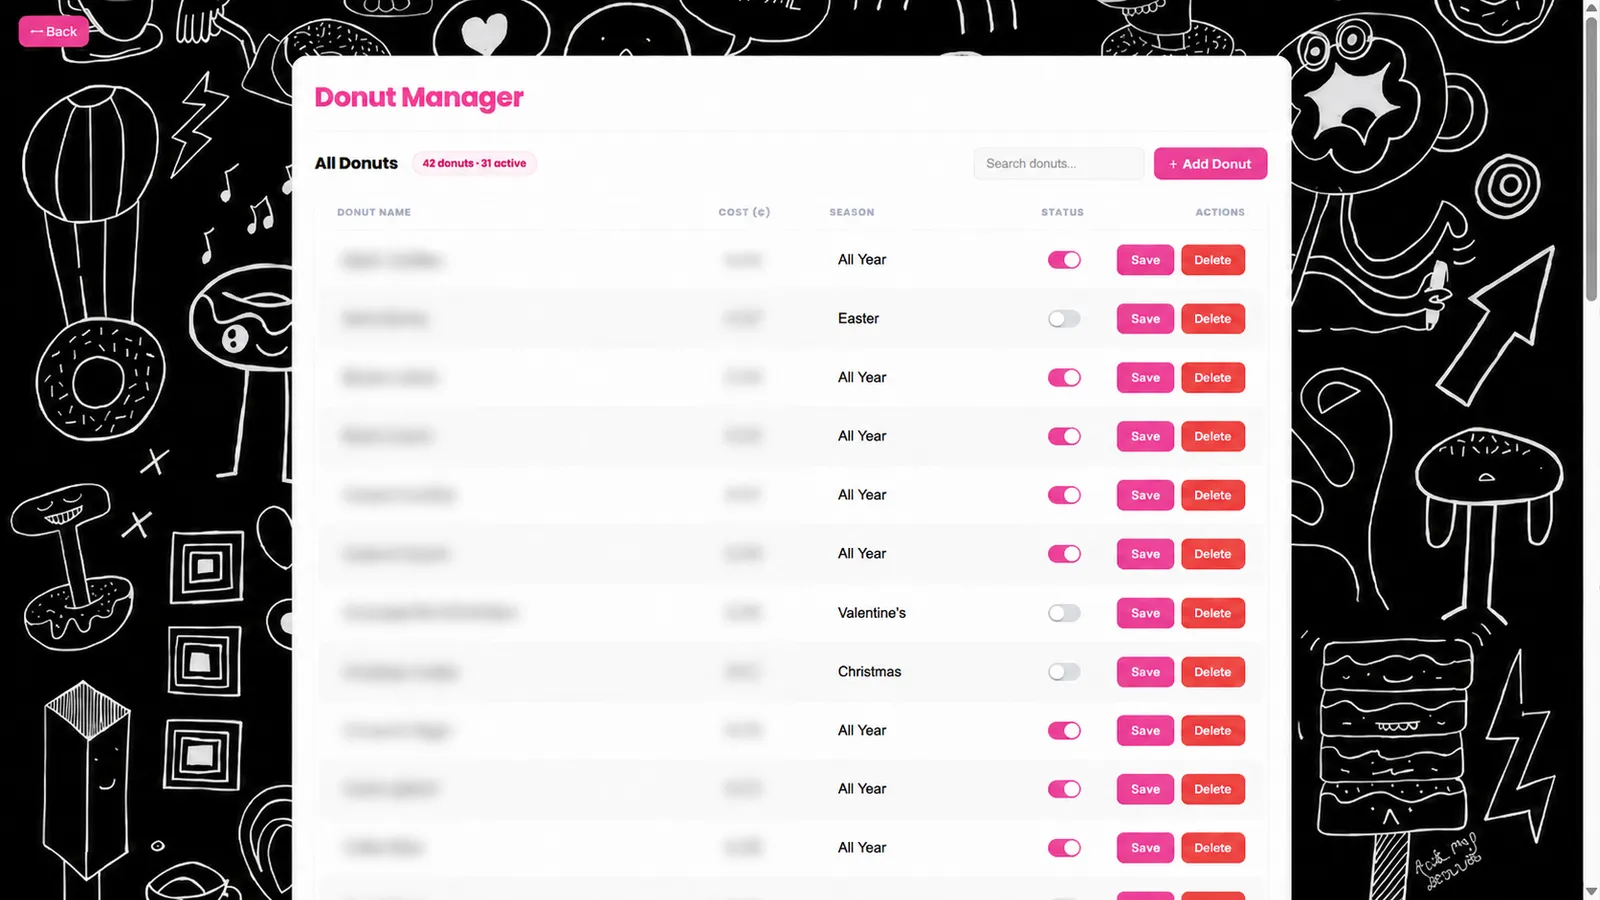
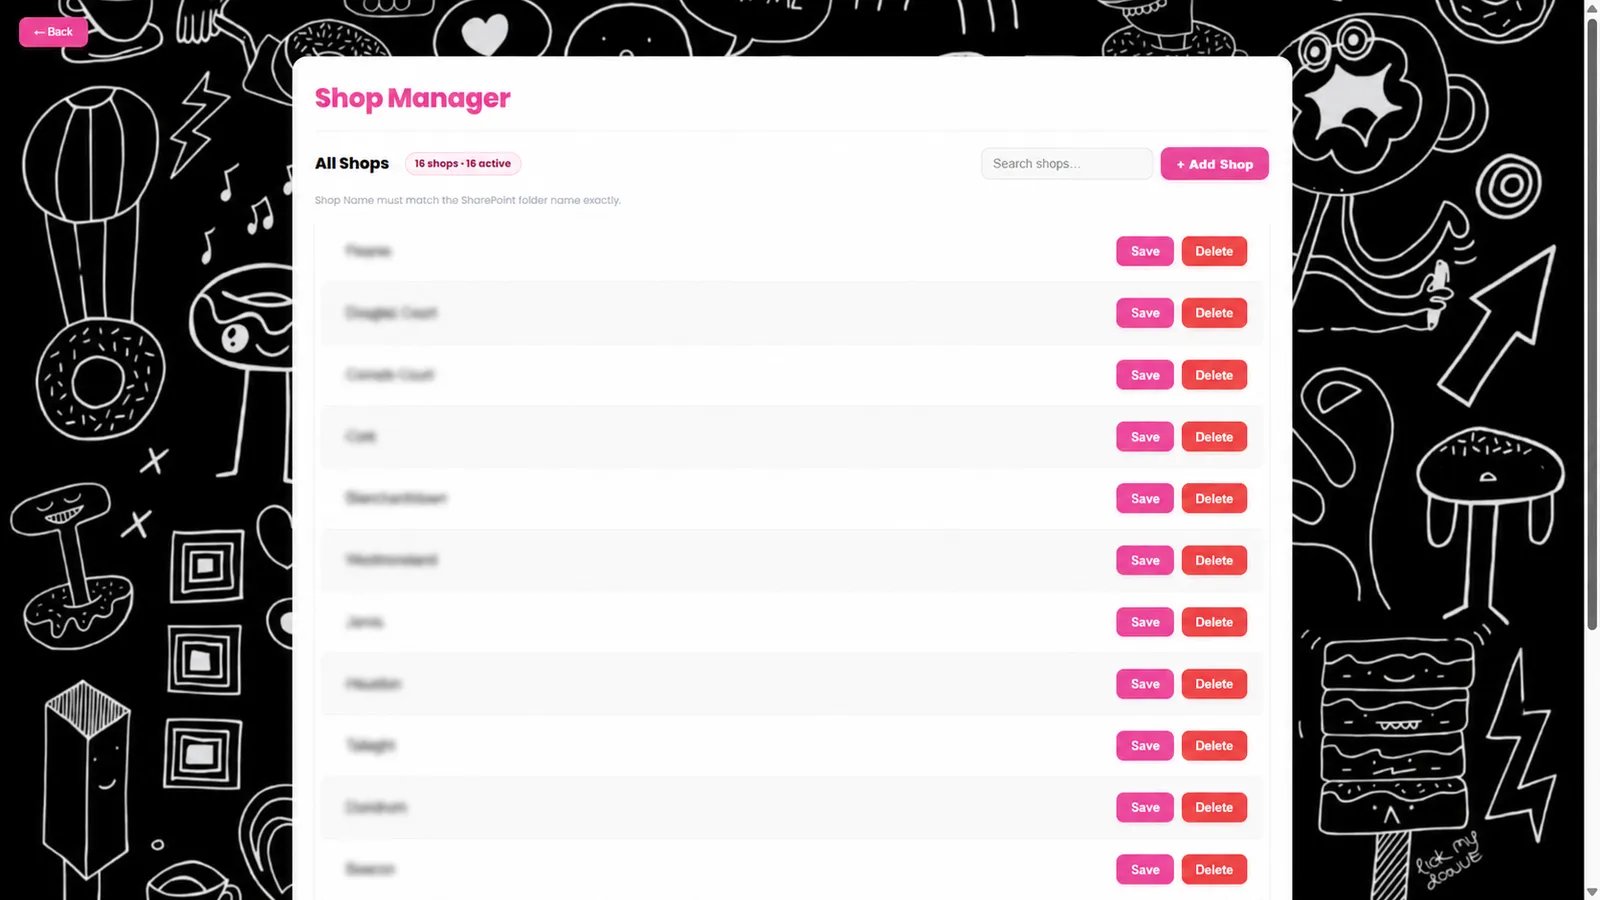
A password-protected admin interface lets managers add new shops and donut varieties without developer support. Seasonal varieties can be marked active or inactive, keeping the tracker clean and relevant for staff.
Product and Shop Management
The system was designed to stay flexible as the business changes. Managers can add new shops and donut varieties themselves without developer support. Seasonal donut varieties can be marked as active when they are being produced and inactive when they are not — keeping the tracker clean and relevant so staff only see the products currently being made.
The App
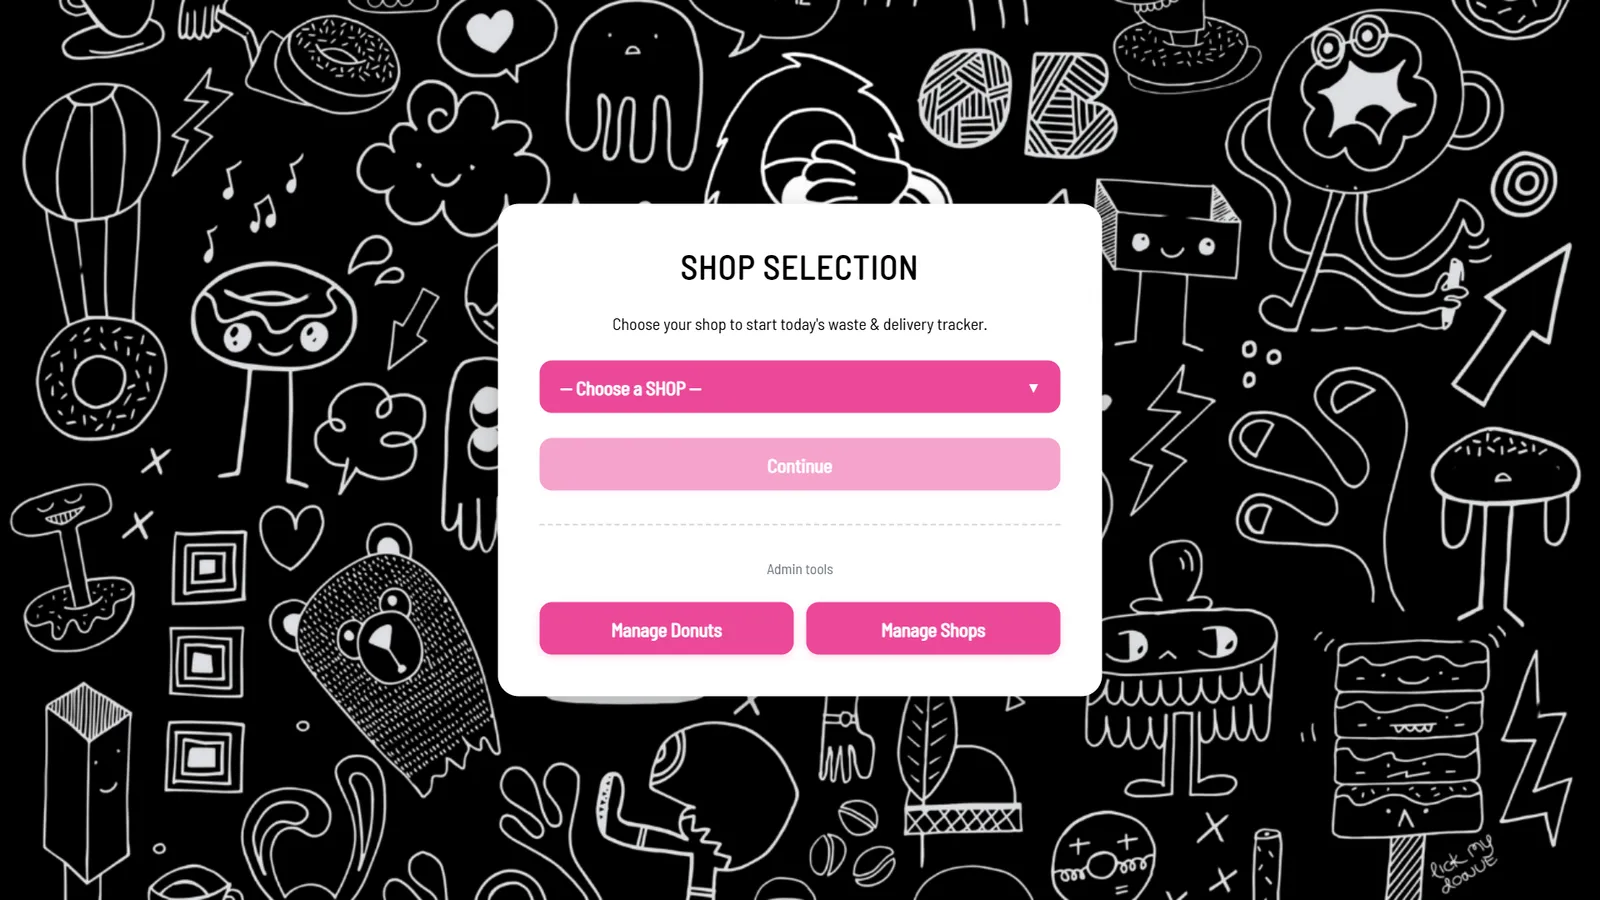
Offbeat Waste & Production Tracker — in action
A streamlined daily entry interface for recording topped donut production, waste by variety, production runs, and shop-level untopped donut deliveries.
Phase 2 — Analytics
Offbeat Waste & Production Dashboard
Once the tracker was capturing consistent daily data, the Offbeat Waste & Production Dashboard was built to turn that data into useful insight. The dashboard gives directors, operations managers, and managers the ability to compare performance across 14 locations and quickly identify where waste, production, or product mix needs attention.
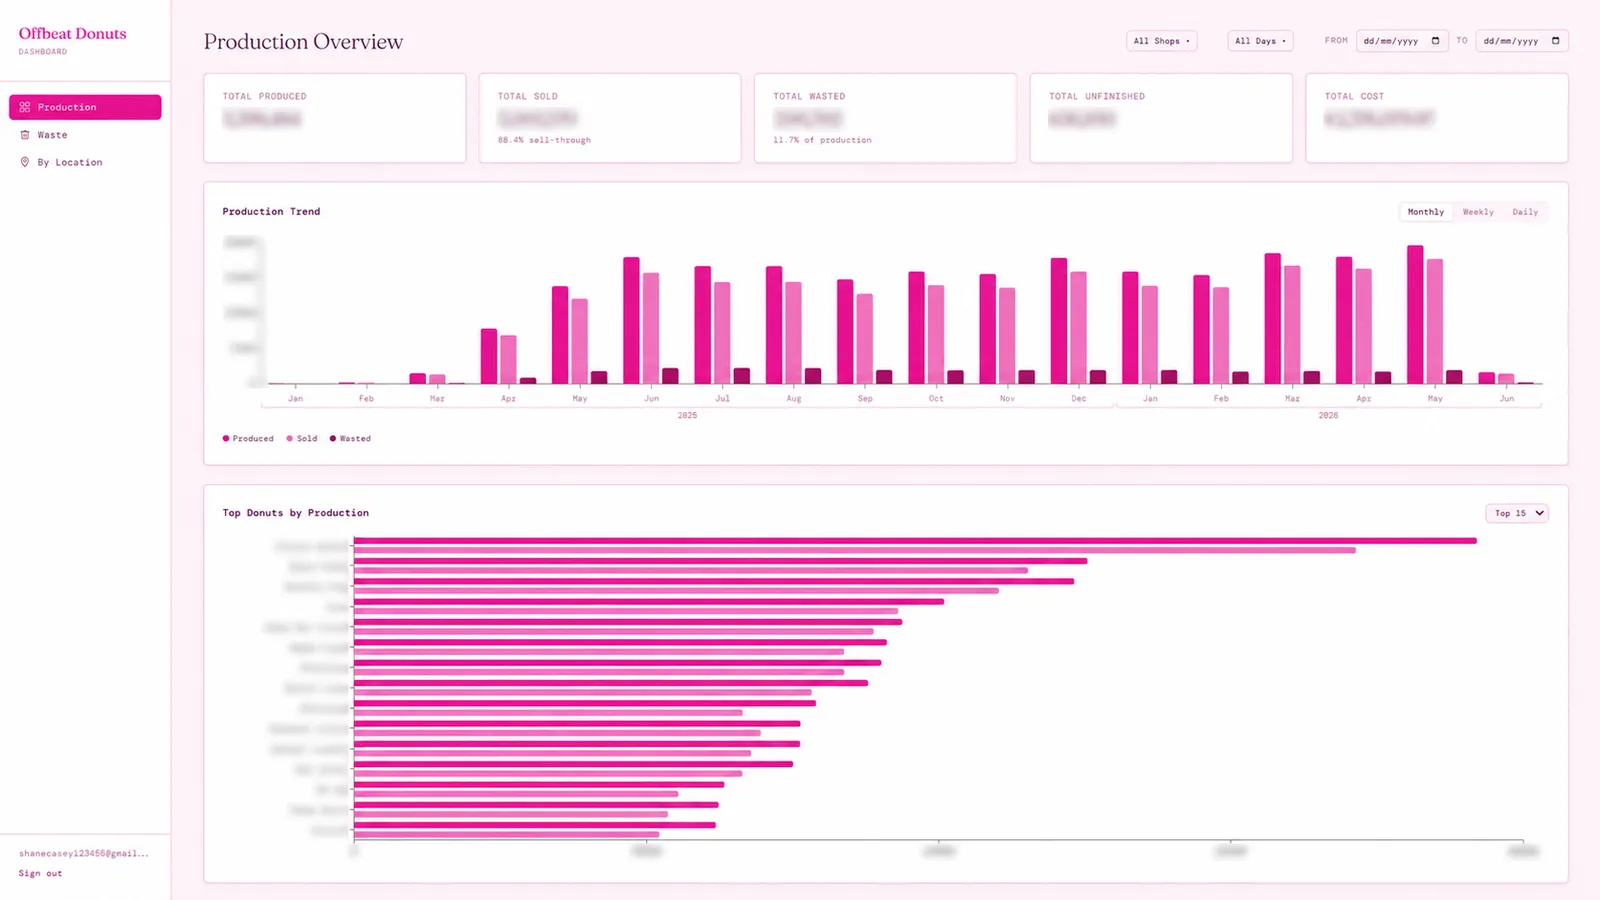
Production & Waste Overview
Track total production and waste over time, grouped by day, week, or month. See waste as a percentage of production by variety and identify which products are consistently underperforming across the estate.
Shop Performance Comparison
Side-by-side performance cards for all 14 locations — production output, waste rate, and delivery data in a single view. Immediately surface which shops are optimised and which need attention.
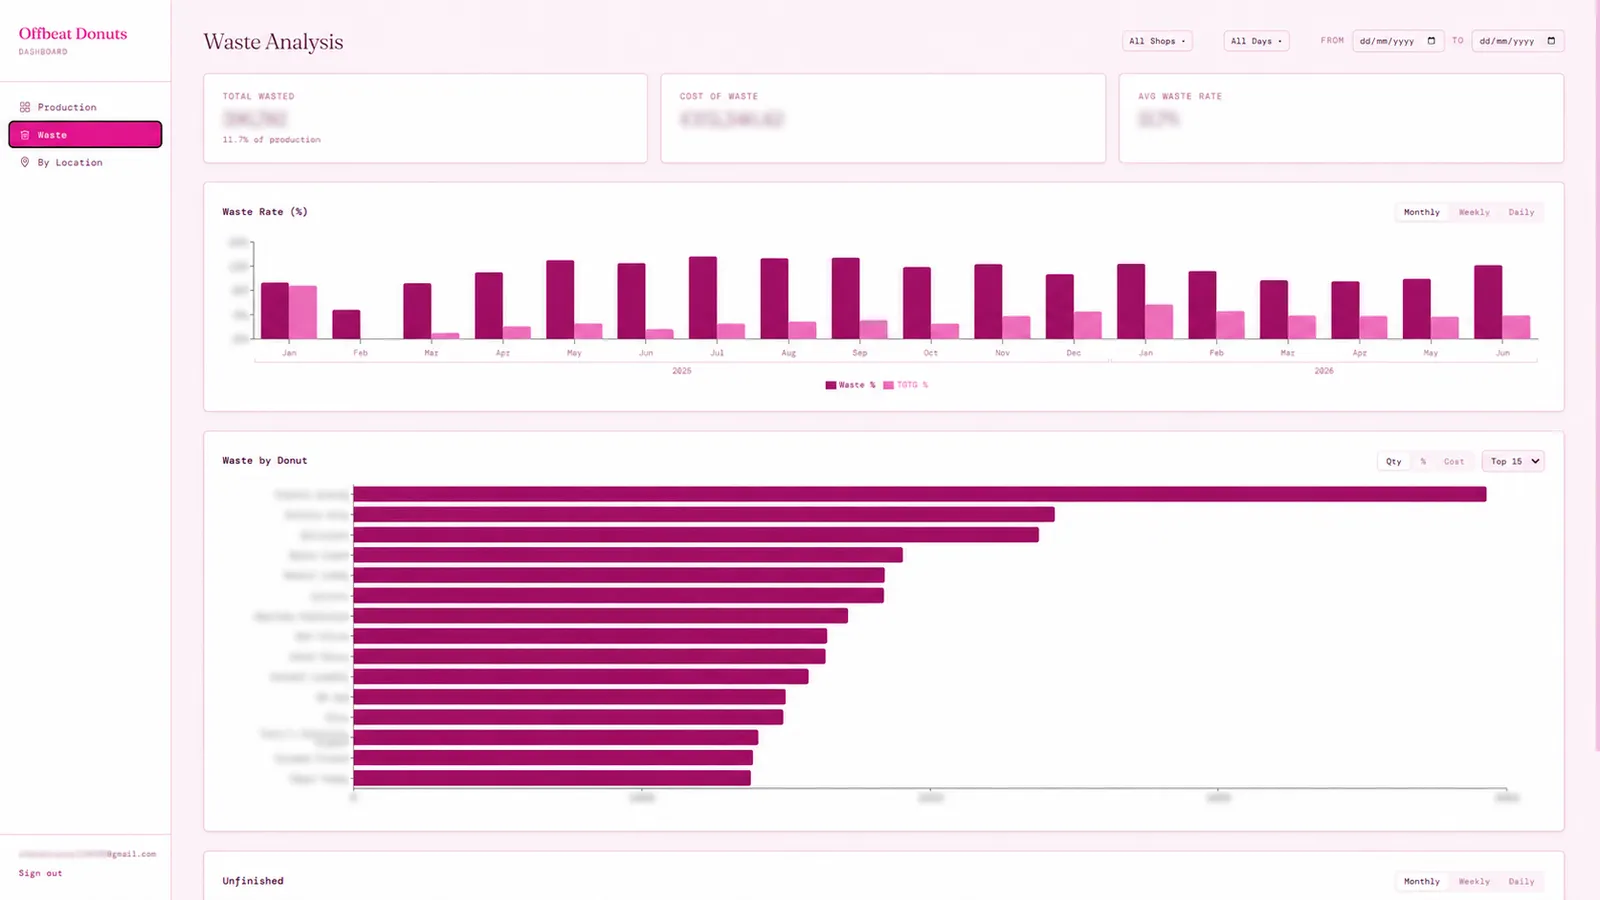
Product-Level Waste Analysis
Drill into waste by donut variety across every location. Identify which finished products are generating the most waste, which shops are overproducing specific varieties, and which products may not be selling strongly enough.
Production Run Visibility
Connect waste back to when production happened. If a shop has high waste for a particular variety, users can see the production runs and assess whether too much was produced late in the day or whether the product mix needs adjustment.
Questions the Dashboard Helps Answer
The dashboard gives directors and managers a more balanced view of performance — high waste may mean production needs to be reduced, but very low waste can indicate that displays are understocked and sales opportunities may be missed.
The Dashboard
Offbeat Waste & Production Dashboard — in action
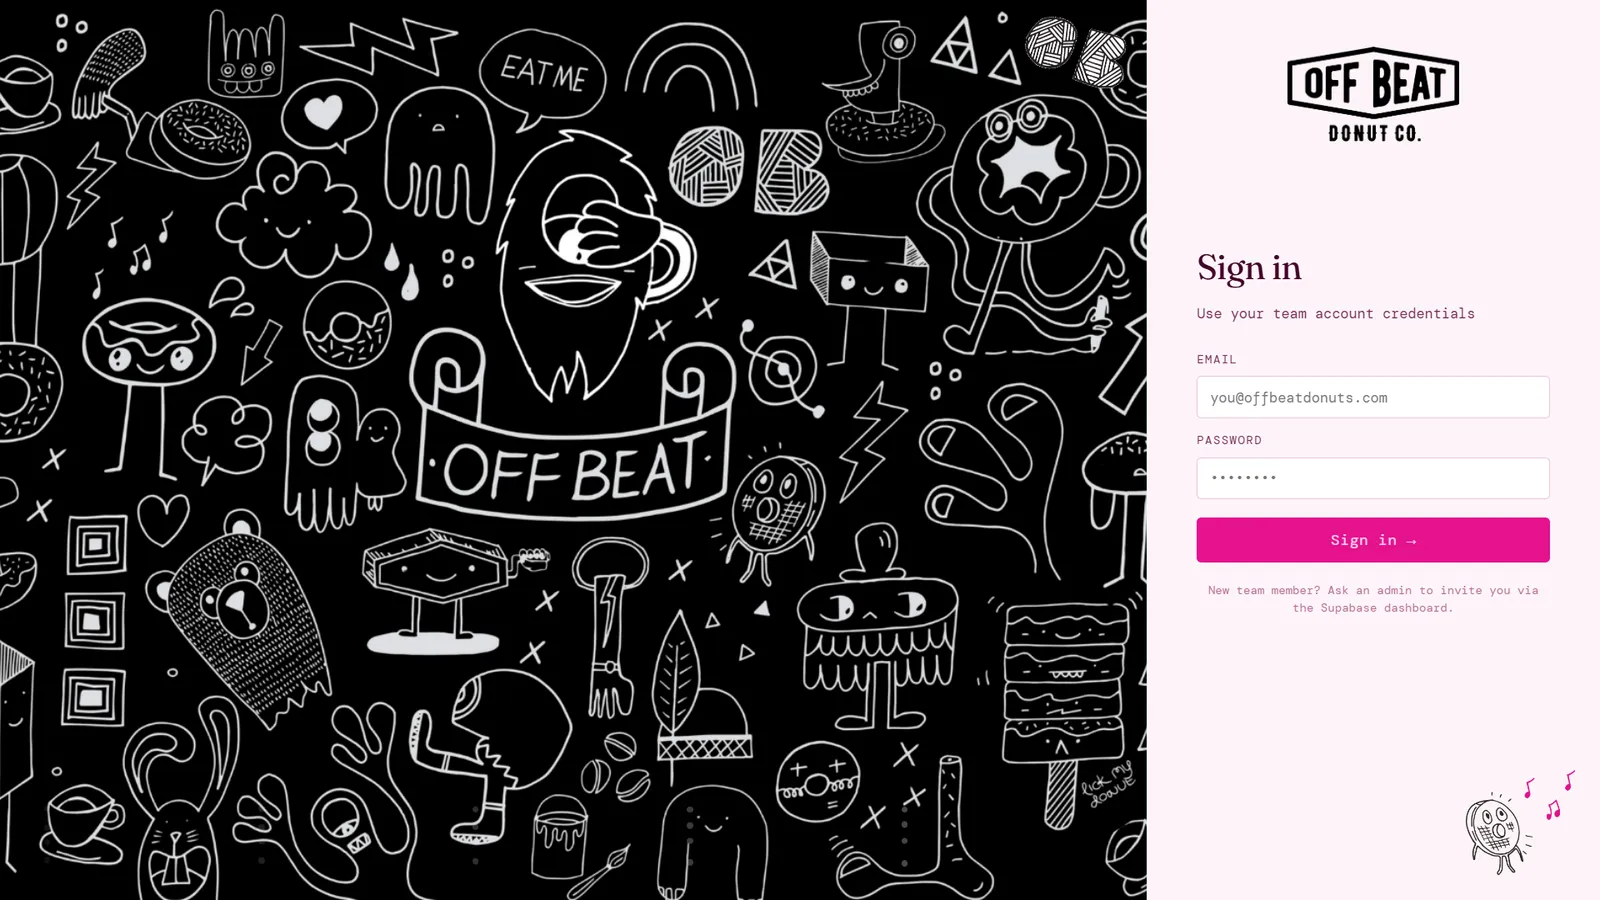
Three interactive views surface waste, production, and location performance across all 14 shops — with filtering by product, location, and day of week.
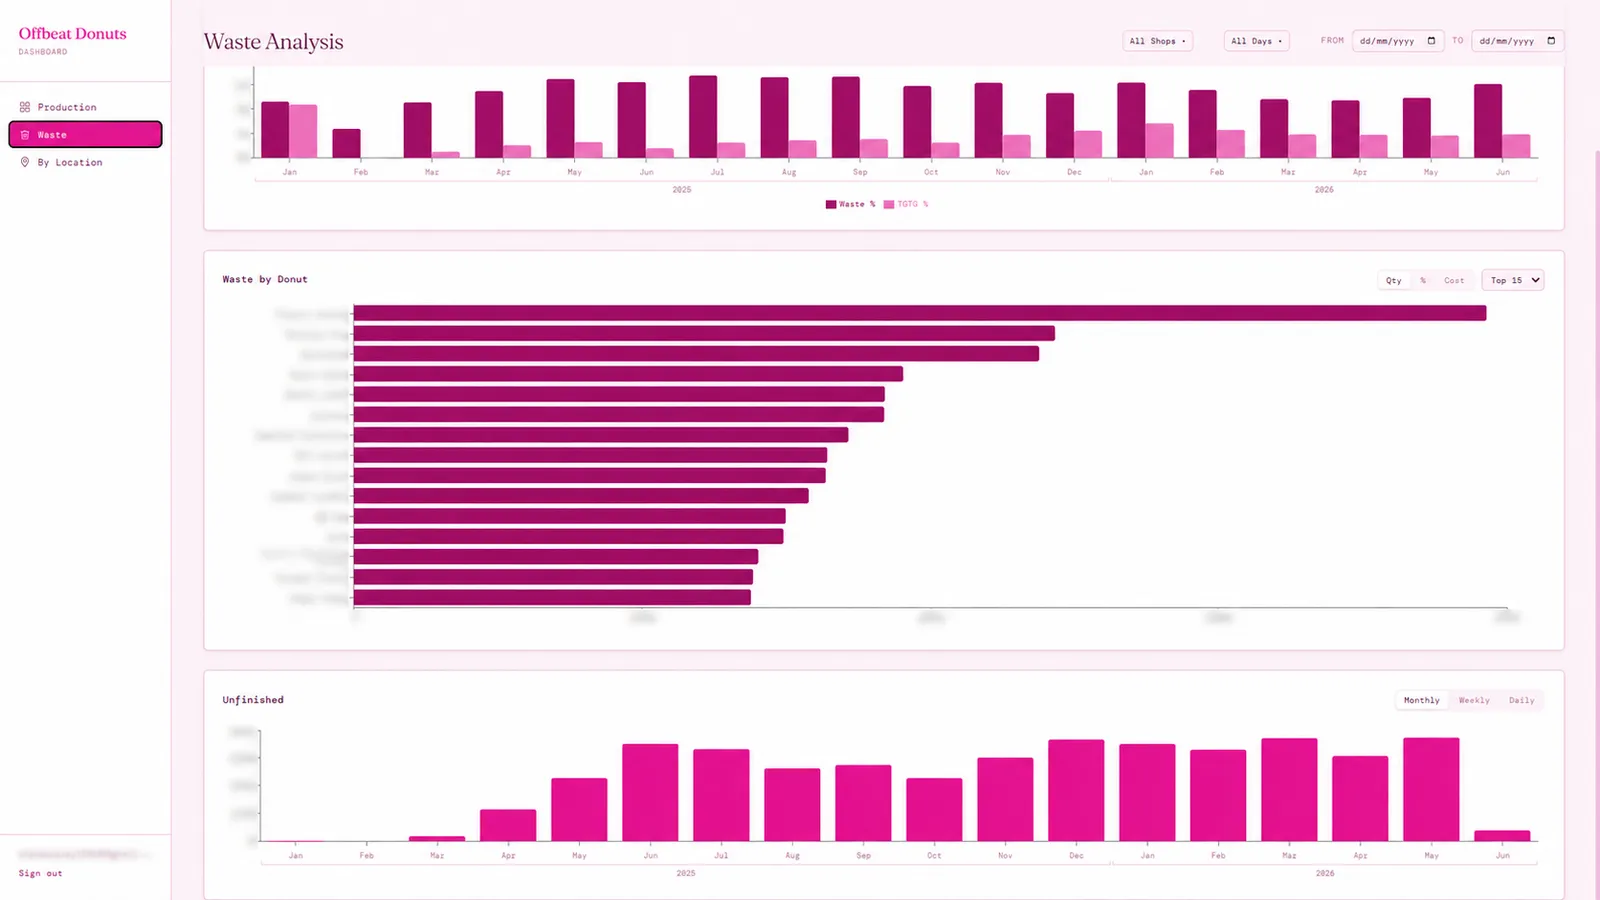
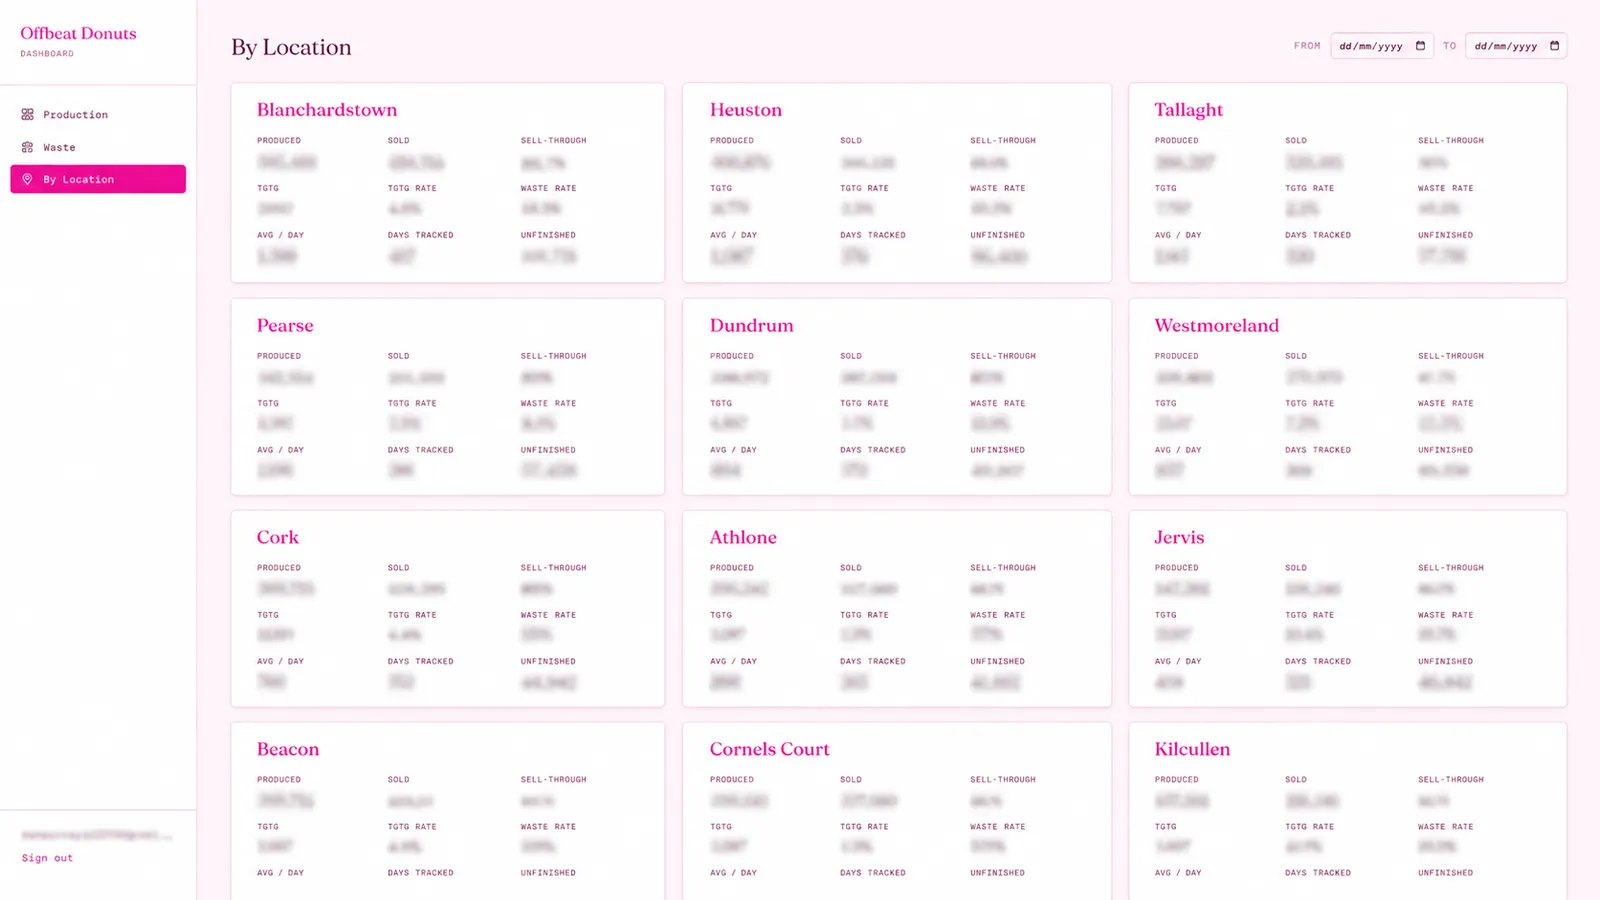
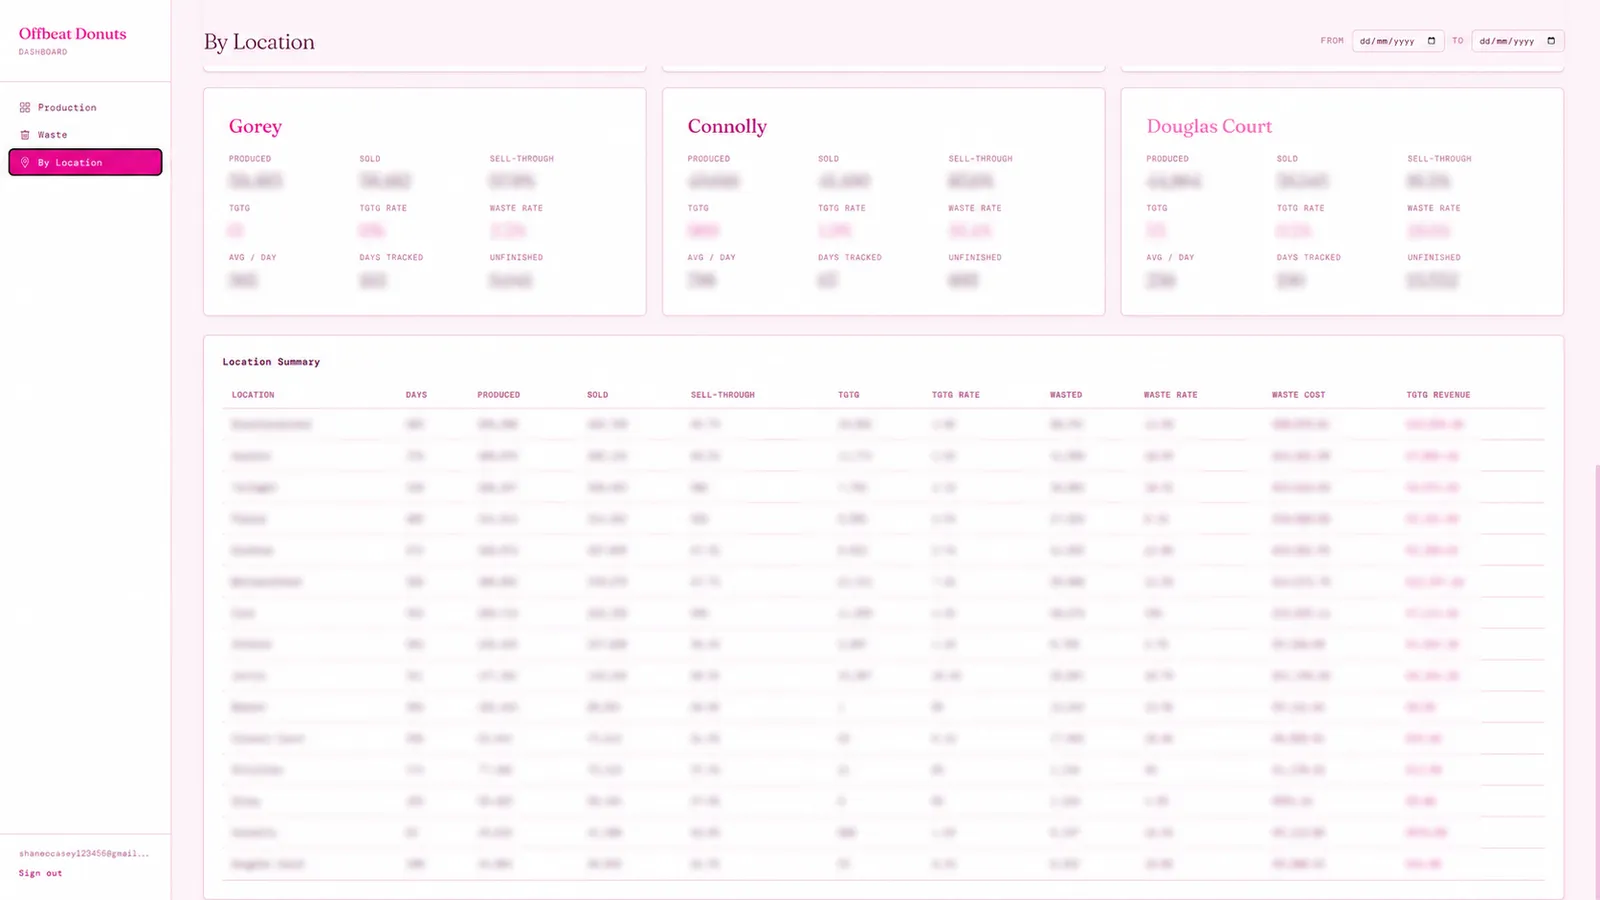
Production Run Analysis
Understanding why waste happened, not just that it did
A key feature of the dashboard is the ability to connect waste back to production runs. If a shop has high waste for a particular donut variety, users can drill into the production runs and see how much was produced throughout the day.
This helps managers identify whether too much was produced late in the day, whether a product is underperforming, or whether production quantities need to be adjusted. Instead of only seeing that waste happened, the team can investigate why it happened.
Location & Product Performance
Comparing shops and products to drive better decisions
The dashboard shows which shops are performing worst for waste and allows users to deep dive into each location. Managers can review waste percentage by donut variety, compare performance between locations, and identify products that may need to be reduced, changed, or removed.
The same analysis also supports increases in production. If a product is popular and waste is consistently low, the business can review whether production should be increased to avoid empty displays and missed sales.
Results & Impact
From limited tracking to structured operational visibility
The project transformed Offbeat Donuts from limited, text-based tracking into a structured production and waste analytics system across 14 locations. Before, decisions were based largely on gut feel. Now, managers can compare waste and production across locations in seconds.
“Data Driven Decisions helped us transform hundreds of files of raw data into clear, actionable insights. This gave us visibility we never had before, helping us improve sales, reduce waste, and optimise production.”
Brian O'Casey
Director, Offbeat Donuts Co.
Built With
Related services
Services used in this project
Still making production decisions from gut feel?
If your business needs better visibility over production, waste, deliveries, or location performance, a custom tracker and dashboard can help turn daily operations into clear, actionable decisions.