The Bare Pantry Food Company
How The Bare Pantry Food Company Saved 3–5 Hours Every Week with a Daily Sales Analytics Dashboard
The Bare Pantry Food Company was manually creating weekly sales reports from spreadsheets, costing the team 3–5 hours every week and slowing down commercial decisions. A secure, database-connected sales analytics dashboard was built to update daily and give directors, finance, telesales, and operations a single source of truth across sales, products, buyers, and order trends.
At a Glance
The project in brief
Industry
Food & Beverage / Food Business
Company Size
Directors, accountant, telesales staff, and operations team
Challenge
Manual sales reporting from spreadsheets, limited visibility, and slow access to commercial insights
Solution
A secure, authenticated, database-connected sales analytics dashboard that updates daily
Key Results
The Challenge
Manual spreadsheet reporting that slowed commercial decisions
The Bare Pantry Food Company was relying on manually created spreadsheet reports to understand sales performance. Each week, sales reports had to be prepared manually, taking around 3–5 hours of work. This created a slow and repetitive process that depended on spreadsheets being updated, checked, and interpreted before the business could get a clear picture of performance.
The challenge was not just the time involved. The manual reporting process made it harder for the team to quickly answer important commercial questions:
- Which products are performing best?
- Which buyers are ordering most often?
- Which sales trends are emerging?
- What information is needed for stock planning?
- Which customers need follow-up?
- What data can support telesales conversations?
Because reporting was manual, visibility was always delayed. The business needed a faster and more reliable way for directors, finance, telesales, and operations to work from the same sales data.
Before vs After
From manual spreadsheet reporting to daily automated sales visibility
Before
- Manual weekly sales reports built from spreadsheets — 3–5 hours of work
- Reports had to be compiled before the team could review performance
- No quick answers to commercial questions without manual effort
- Visibility always delayed
- Data spread across spreadsheets with no single source of truth
After
- Dashboard updates daily — no manual report creation
- Directors, finance, telesales, and operations access insights directly
- Instant answers to commercial questions
- Daily visibility into sales performance
- One central source of truth across the whole business
The Solution
A secure, database-connected dashboard built around how Bare Pantry operates
Instead of manually compiling spreadsheet reports, the dashboard updates daily and gives the team a single source of truth for sales performance. It was designed to support the way Bare Pantry actually manages sales, customers, products, and commercial decision-making.
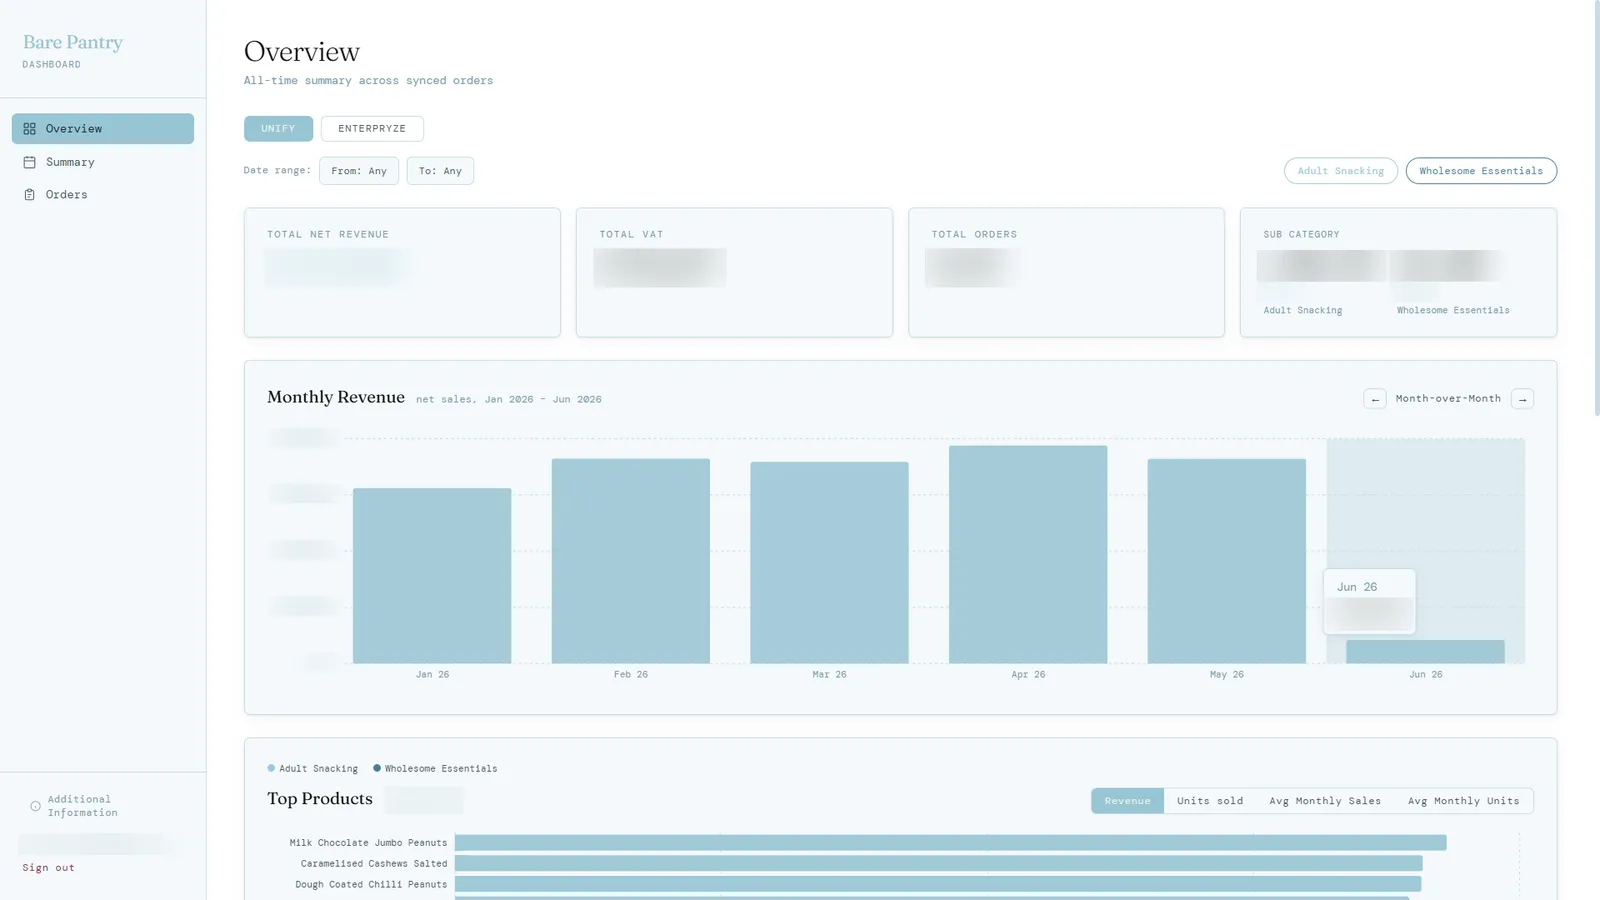
Sales Overview Dashboard
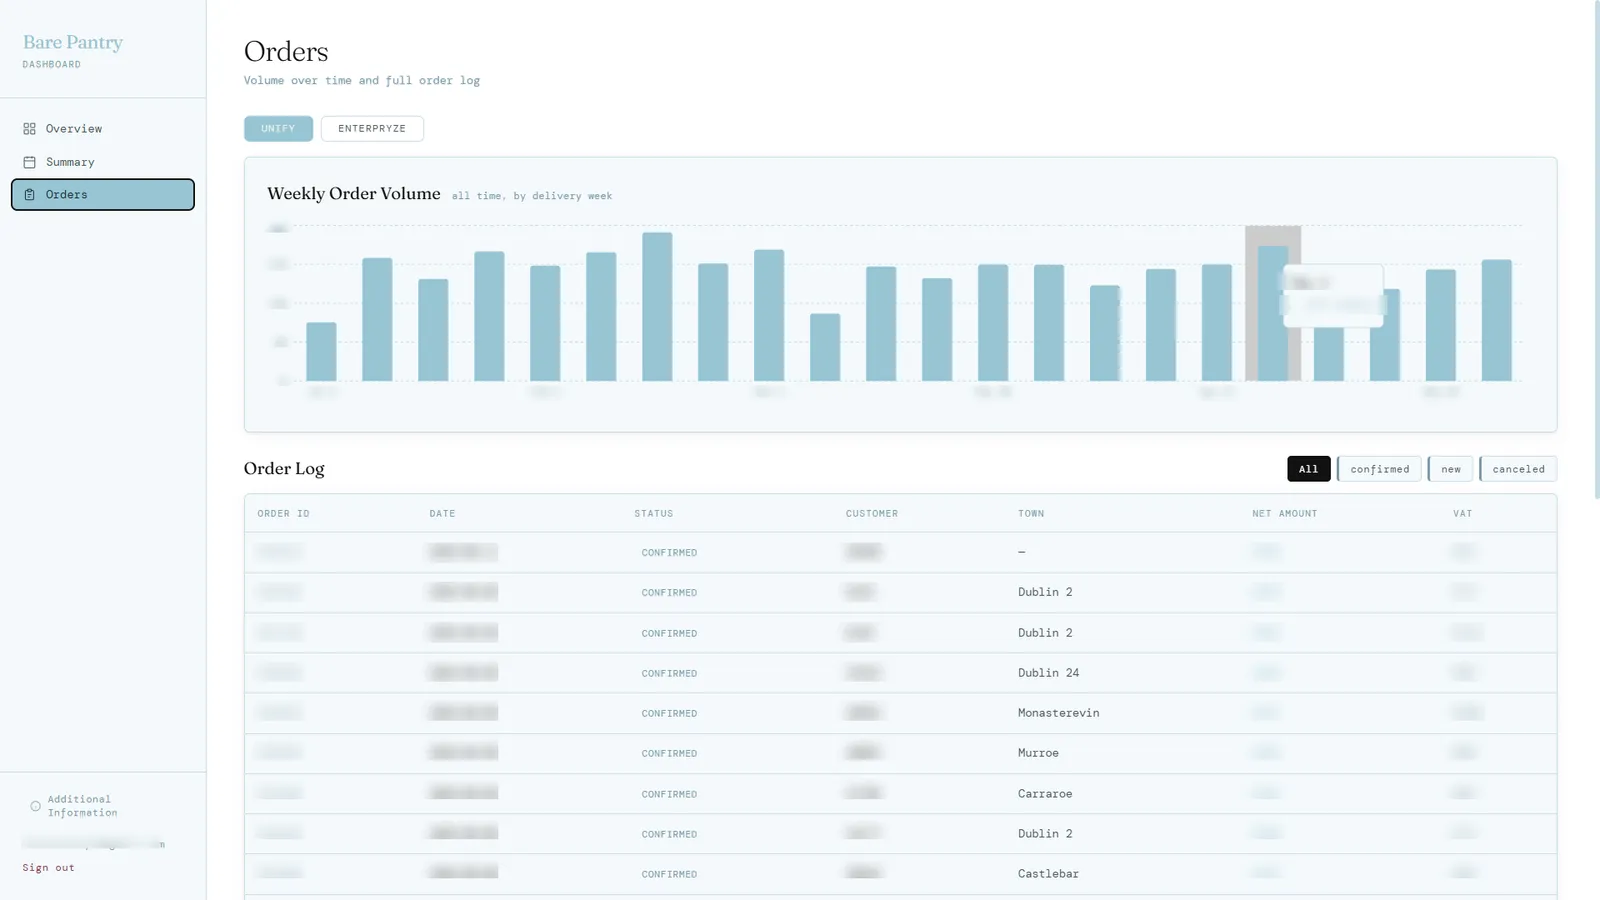
KPI cards for total revenue, VAT, order count, and completed orders. A revenue chart lets users view performance over time, helping directors and finance quickly understand whether sales are moving in the right direction.
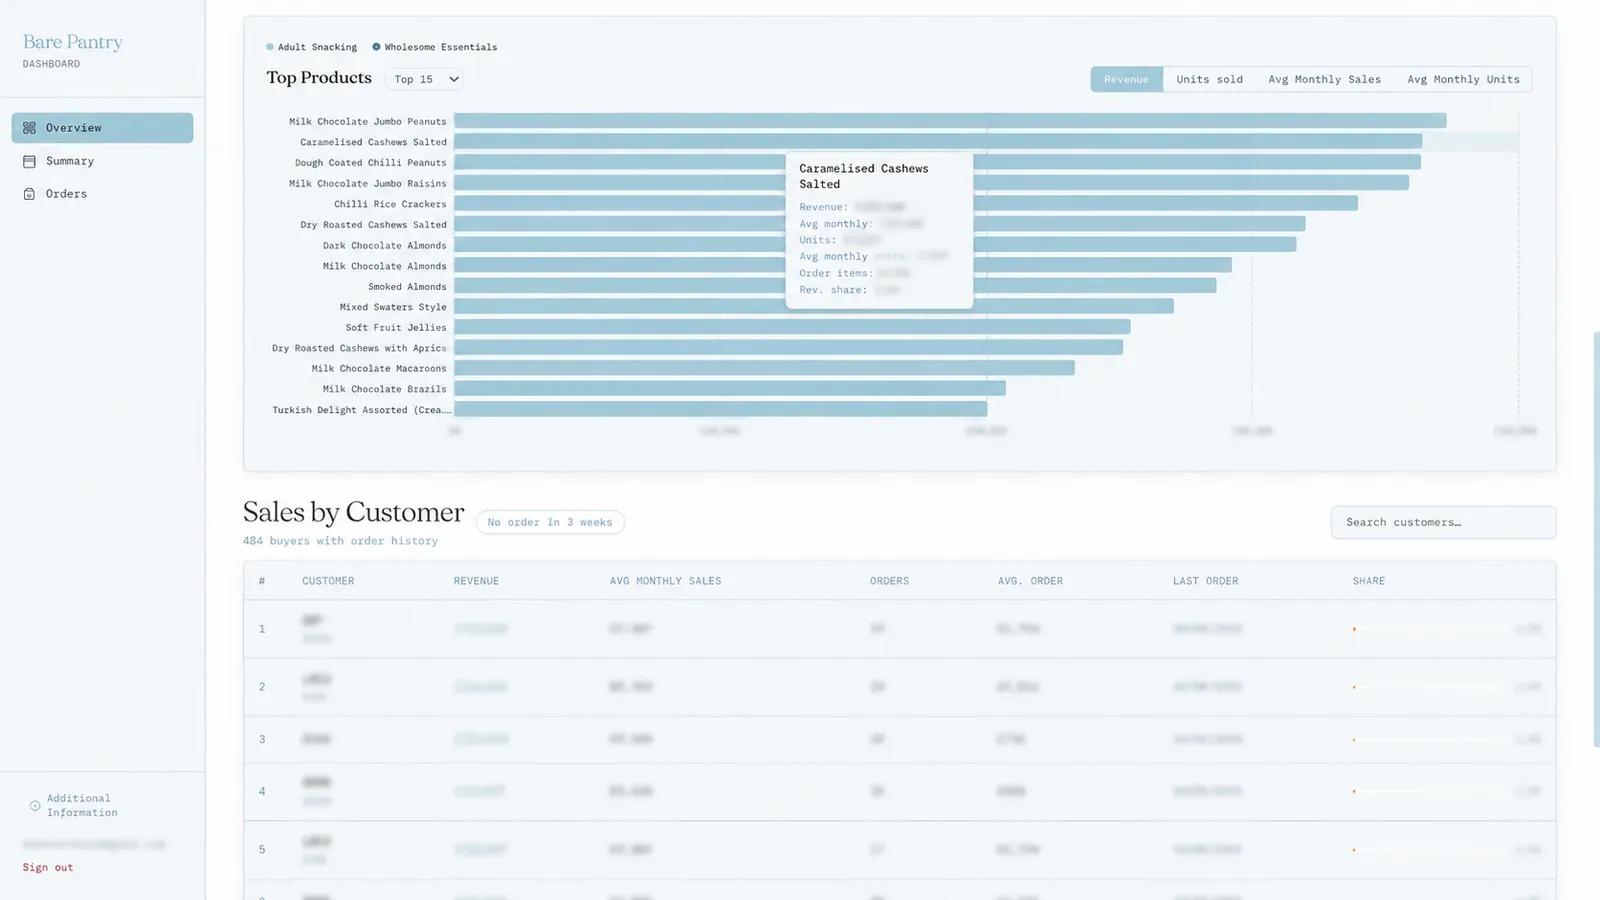
Top Products Analysis
Ranks products by revenue and units sold, helping the team identify strong performers, spot underperforming products, and support better stock planning and ordering decisions.
Sales by Buyer
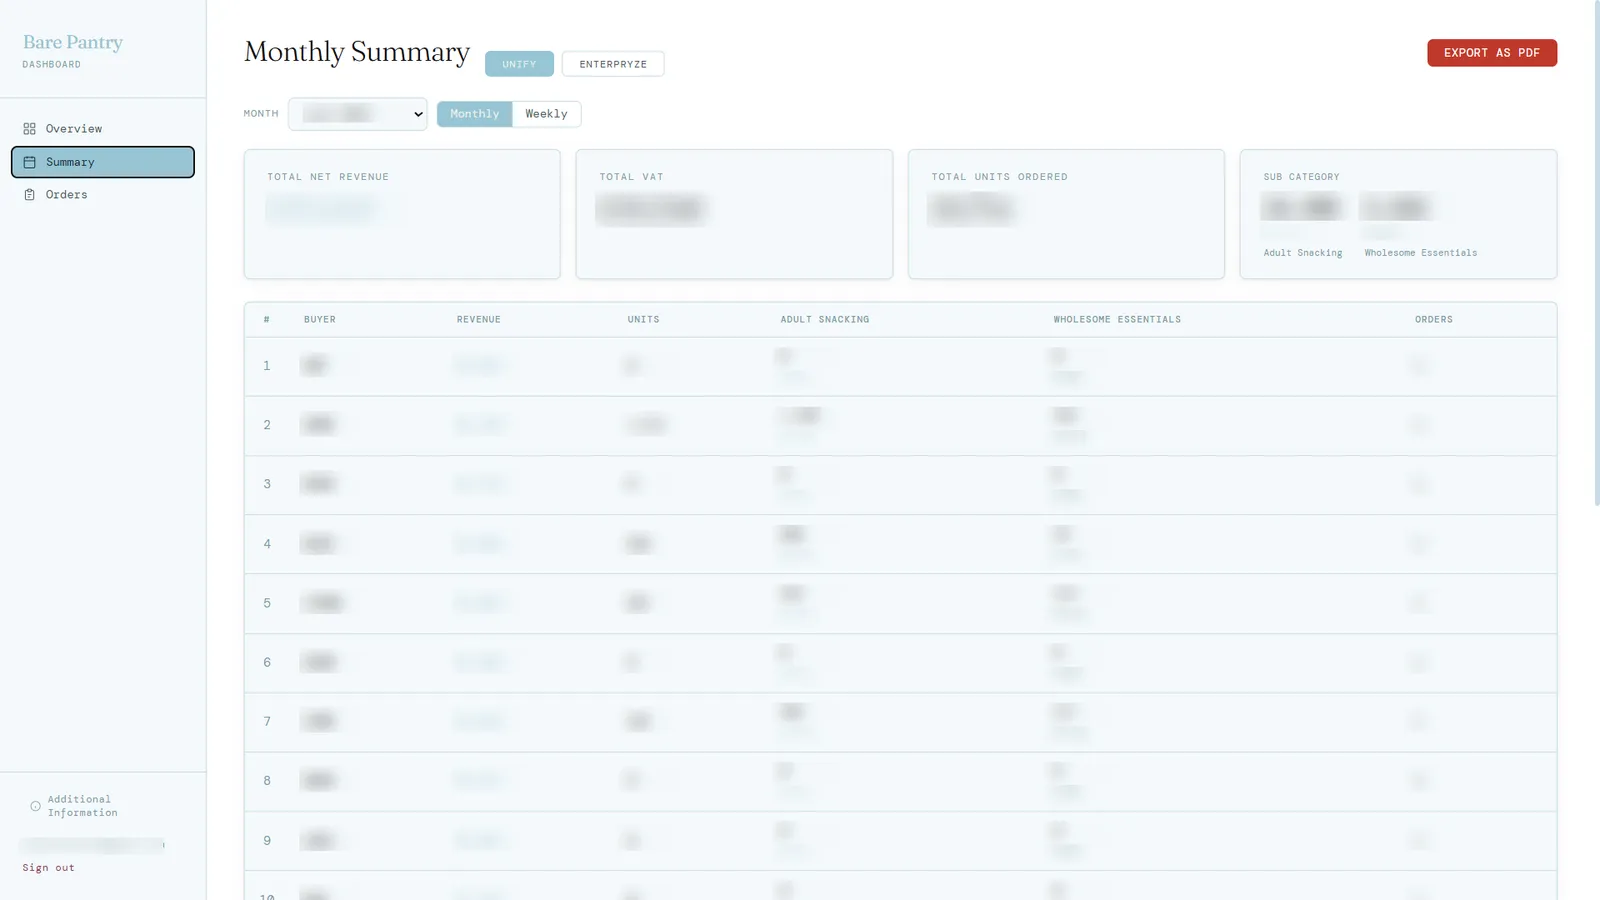
Customer-level breakdown showing buyer contribution, order history, and revenue share — making it easy to see which customers are driving sales and where follow-up may be needed.
Order Volume Tracking
Monitors order trends over time, giving operations and management better visibility into changing demand, order patterns, and fulfilment activity.
Custom Business Filters
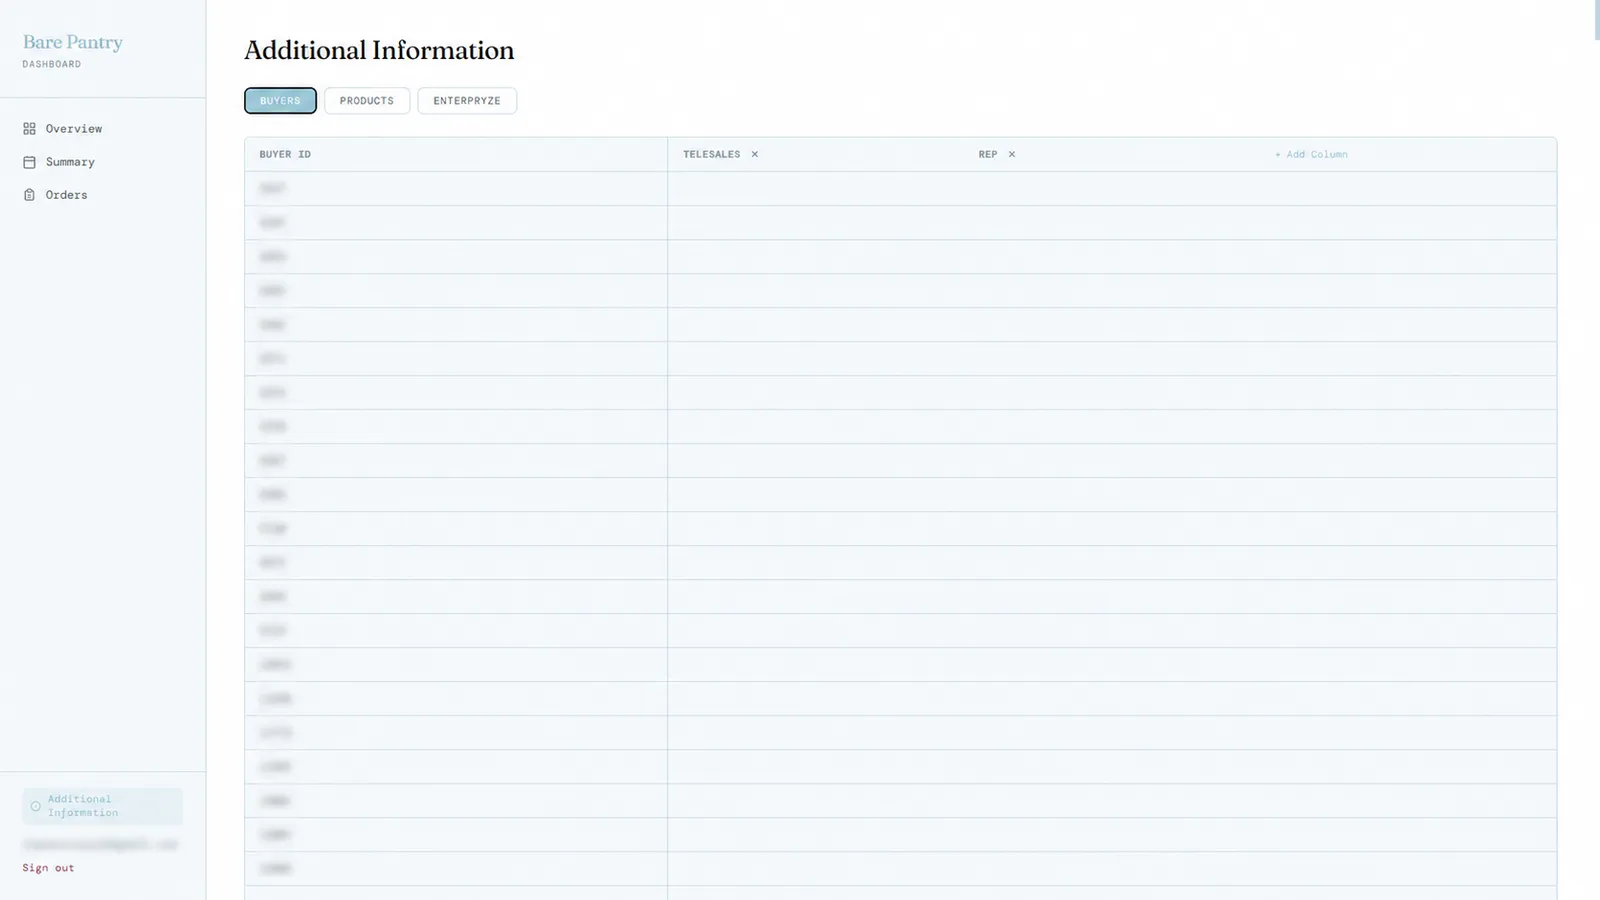
The dashboard supports custom fields and filters based on how Bare Pantry wants to analyse its business — so reporting is never limited to a fixed structure. The business can filter and segment data in ways that are actually useful for sales, operations, finance, and customer management.
The App
See it in action
A purpose-built dashboard giving the Bare Pantry team live visibility across revenue, products, customers, and orders — no spreadsheets, no waiting for a report to be compiled.
Results & Impact
Daily visibility where there was none before
The dashboard replaced a slow manual reporting process with a daily, database-connected analytics system. The most immediate result was saving 3–5 hours every week by removing the need to manually create sales reports from spreadsheets — and before the dashboard, the team had to wait for reports to be compiled before they could review performance.
“Their tools and insights have saved us significant time each week and given us better visibility over our business, allowing us to make faster, more informed decisions.”
Peter Carr
Director, The Bare Pantry Food Company
More for Bare Pantry
What we built next
Related services
Services used in this project
Still building reports manually?
If your team is spending hours every week preparing sales reports, a custom dashboard can give you faster visibility, cleaner data, and better decision-making without relying on spreadsheets.